Bethesda, MD
United States
Child Trends developed a data visualization that illustrated the relationship between educational opportunity and life expectancy for adolescents and young adults for the first time. By linking USALEEP data with educational data, the team was able to examine a crucially important social determinant of health and communicate its implications for life expectancy. Child Trends produced a single-page web narrative to illustrate the relationship between educational opportunities and youth life expectancy. It features a detailed interactive map of the US that juxtaposes community life expectancies and educational opportunities at individual high schools, as well as a narrative around key findings. This data visualization clarifies for education officials the potential long-term health implications of gaps in educational opportunity. It also provides them a powerful tool for engaging health advocates in efforts to build political will for increasing investment in schools and pursuing educational equity. This project demonstrated a strong cross-sector approach to examining health equity that is relevant to other communities interested in pursuing similar approaches.
HOW THEY USED 500 CITIES DATA
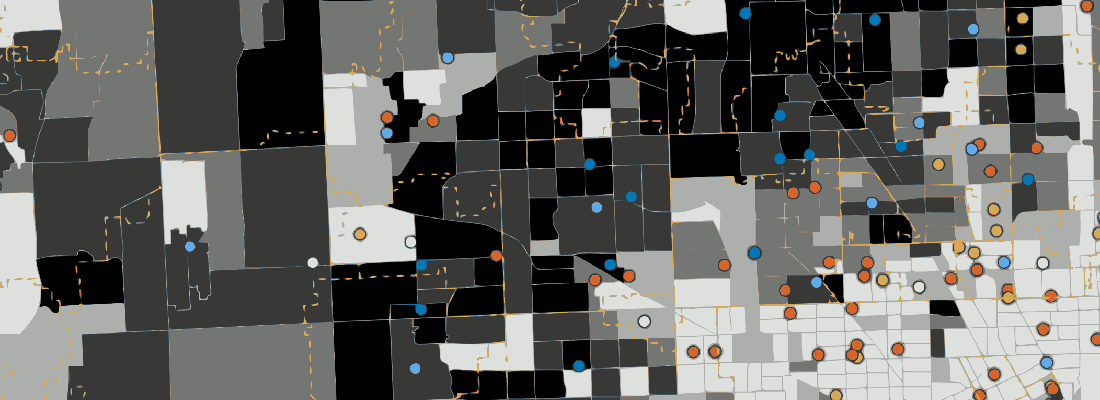
Child Trends data visualization Mapping the Link Between Educational Opportunity and Life Expectancy compares high school educational opportunity and life expectancy estimates for teenagers census tracts across the country to help policymakers understand ways they can address the life expectancy gap. While research has found that people with more education live longer lives, it’s difficult for policymakers to take direct action to improve their constituents’ educational attainment. Because educational opportunity sets the stage for education attainment, understanding the connection between life expectancy and educational opportunity will help policymakers understand how to improve the health and extend the lives of teenagers across the country.
Child Trends researchers measured educational opportunity by examining the following conditions within a neighborhood’s nearest high school(s): access to rigorous academics, including the availability of AP courses and dual enrollment programs that let students gain college credit; supportive conditions for learning, including levels of chronic absenteeism and out-of-school suspension; availability of nonacademic supports, including school counselors, nurses, and psychologists; and teacher experience. Researchers confirmed that neighborhoods with more educational opportunity, measured using these domains, had higher graduation rates.

Then, researchers merged the school data with the life expectancy data from the U.S. Small-Area Life Expectancy Project . The geographic specificity of the USALEEP data allowed Child Trends to examine the link between educational opportunity at individual schools and life expectancy for the first time. Researchers did this using a regression analysis to examine the relationship between educational opportunity and life expectancy. This analysis was exploratory, rather than causal, and included basic demographic variables as controls. They found that educational opportunity explains a small, but meaningful part of the difference in life expectancy between neighborhoods: 6 percent. A neighborhood’s life expectancy was also related to larger, systemic inequities faced by its residents on the basis of their race, ethnicity, and income.
Child Trends presented the results of the analysis in a “scrollytelling” scatter plot which walks users through the data story. Researchers also wanted users to be able to explore the data on their own, so they created an interactive map which displays neighborhood life expectancy and school educational opportunity. The map also includes a feature to jump to certain cities and filter neighborhoods by community demographics. Child Trends also outlined their methods and limitations in designing their analysis of educational opportunity and life expectancy.
WHAT THEY LEARNED
Gaps in educational opportunity represent a meaningful challenge policymakers can tackle to improve the lives of youth. Education and health decision makers can use this tool to improve educational opportunity in their backyard. To improve teen life expectancy, education and health officials at the state and local levels should collaborate to identify communities with low educational opportunity and enact reforms to improve practice and bolster access to staff and resources.
Policymakers must also understand that, for many communities, short life expectancy and low educational opportunity are often coexisting disadvantages rooted in long-standing systems of inequity, such as past school and housing segregation policies. As policymakers work to address these longstanding inequities, they can use this tool to examine how improving educational opportunity in their neighborhoods may positively influence the health of children and youth.
WHAT THEY RECOMMEND FOR SIMILAR PROJECTS
Child Trends has identified a few recommendations for organizations interested in conducting similar projects centering in the 500 Cities data, outlined below:
- Difficulty conceptualizing confidence intervals for the regressions when the outcome variable (life expectancy) already had its own level of uncertainty.
- Budgeting appropriate time and staff to make decisions about data linking and geographic analysis. For example, determining which school should correspond to which neighborhood was a complex task that involved the overlap of census tract and school district geographic shape files.
To learn more, follow @ChildTrends on Twitter. If you are interested in learning more about this team’s project approach or have specific questions regarding replicating their work in your community, please feel free to contact the Principal Investigator of this project, Renee Ryberg.