New Orleans, LA
United States
The Data Center of Southeast Louisiana explored the relationship between life expectancy and economic opportunity while highlighting the historical underpinnings of racial and economic segregation at the neighborhood level. The Data Center’s research findings and visualizations culminated in published short and engaging series of "data stories" on their website. To support local efforts to reduce disparities in health and to promote high-impact community investment, these stories illustrate how place shapes efforts to understand and address health and economic inequality. The team collaborated with local stakeholders to amplify the project's impact. In addition, a detailed methodology and replication package has been made publicly available.
HOW THEY USED 500 CITIES DATA
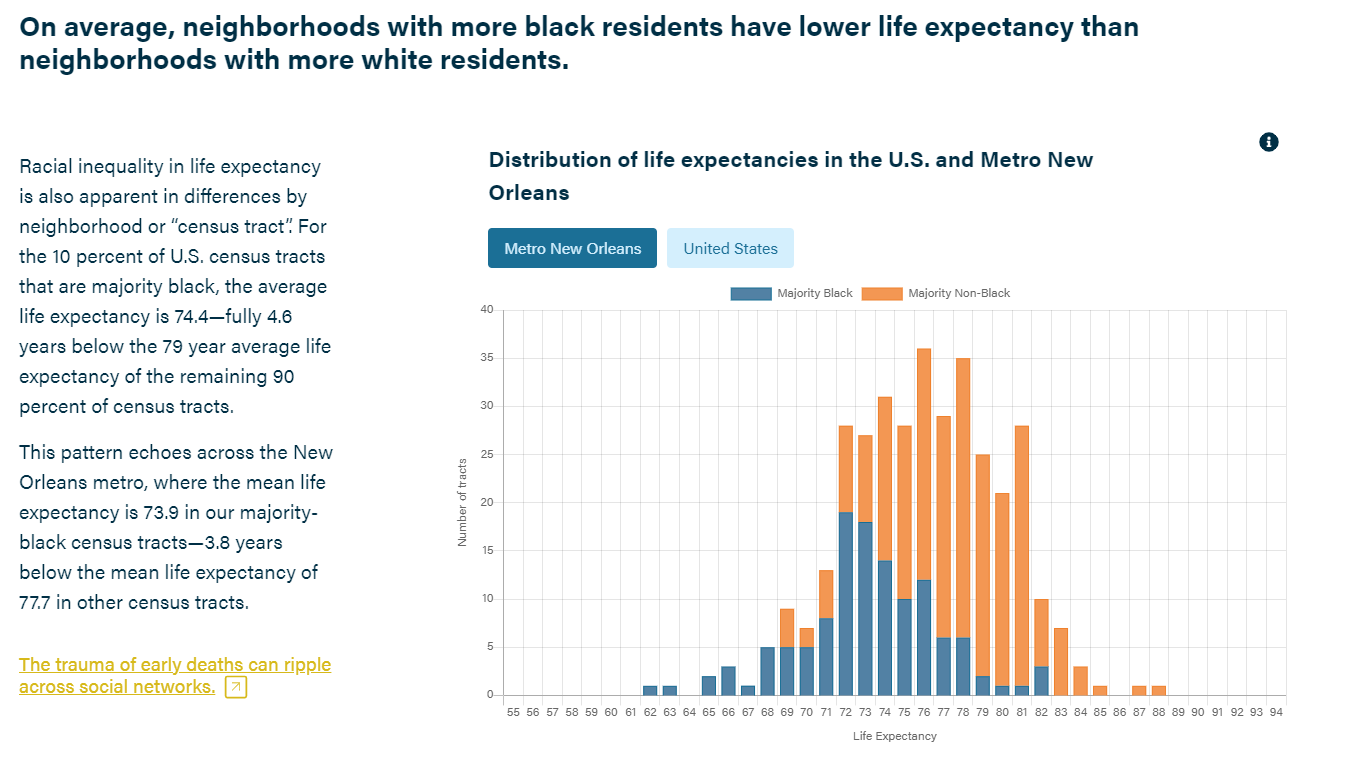
The Data Center of Southeast Louisiana used the U.S. Small-Area Life Expectancy Project (USALEEP) to produce a descriptive analysis of USALEEP variation and its relationship to income mobility and uneven investment. They use the research question, "Why does life expectancy vary so much across neighborhoods?", in order to address the deeper, multi-dimensional issue of neighborhood inequality. First, the Data Center ran correlations and statistical analysis of USALEEP's relationship to other indicators of neighborhood opportunity, including the Opportunity Atlas data on income mobility. They also "up-scaled" the data (to county and state) to better compare variation at different scales of analysis and to compare USALEEP estimates with other estimates of life expectancy. The Data Center also developed a novel analysis of inequality across metro areas, which revealed interesting findings about the effects of inequality. To understand the factors explaining neighborhood-level variation in life expectancy, they experimented with advanced regression analysis methods and cluster analysis to identify typologies of neighborhoods, which is in progress.
The Data Center created website interactive called Placing Prosperity to translate the determinants of disparity and the complexity of causal interpretations of “place”. The website interactive was released in three chapters:
- Chapter 1: Unpacking Neighborhood Differences in Life Expectancy
- Chapter 2: The Origins and Persistence of Neighborhood Inequality
- Chapter 3: Making Sense of Place-based Inequality Over the Life Course
WHAT THEY LEARNED
The main takeaway from their empirical analysis, their reviews of academic and policy literature, and their discussions with stakeholders is that neighborhood data on life expectancy in the Southeast Louisiana region is inseparable from the question of racial equity. There is a diverse range of stakeholders already working on related issues, and the singular focus on life expectancy as an organizing concept resonates with much of what they heard from housing, health, and economic development partners. In short, they believe the timing for this resource is ideal to pull different organizations together around the role of neighborhoods.
The Data Center has also encountered the challenges of the data set. Suppression complicates the aggregation of the data to existing geographies, like official neighborhood designations or counties/parishes (especially rural counties). Also, describing life expectancy in an accessible, non-misleading way can be challenging. The Data Center of Southeast Louisiana was excited by the potential of the Abridged Life Tables as a resource with a direct "use case" for planning public health interventions; but observed outliers, standard errors, and the level of caveats required has dissuaded this approach.
WHAT THEY RECOMMEND FOR SIMILAR PROJECTS
The Data Center of Southeast Louisiana has identified a few recommendations for organizations interested in conducting similar projects centering in the USALEEP data, outlined below:
- Thoroughly explore how the estimates, the abridged life tables, and the standard errors are related and how they shape any locally specific takeaways. Pay special attention if you plan to "upscale" the estimates to other geographies.
- Compare how this data corresponds with other related data that may be available for your county or metro (e.g., life expectancy or mortality) or even locally produced small-area life expectancy estimates. They found that the great value of USALEEP is that it has nearly national coverage, which begs for a comparative perspective.
To learn more, follow @noladatacenter on Twitter. If you are interested in learning more about this team’s project approach or have specific questions regarding replicating their work in your community, please feel free to contact the Principal Investigator of this project, Robert Habans.