Berkeley, CA
United States
Using the 500 Cities data, the University of California, Berkeley assessed the relationship between noise pollution and three 500 Cities health outcomes: hypertension, sleep, and mental health. The UC Berkeley team examined the relationship between noise pollution data and the 500 Cities data through an equity lens. The team integrated key place-based and contextual measures in their analyses and assessed whether and how racial residential segregation amplifies observed associations between noise exposure and health outcomes.
Historically, noise—as an environmental pollutant—has been linked to sleep disturbance, poor mental health, and cardiovascular disease. However, almost no public-health noise research has taken place in the US using recent data, even though people realize that noise affects their sleep, ability to concentrate, and mood.
The UC Berkeley team noticed this major gap in research and began investigating the effects of noise pollution nationwide. Last year, the team used a new nationwide noise model developed by the National Park Service, and found that communities of color and lower socioeconomic status had significantly higher noise levels than their white wealthier counterparts. Additionally, more racially segregated metropolitan areas were louder for both the rich and poor, and for white communities and communities of color. This novel finding suggests that equity is a critical lens through which to examine how environmental quality can affect community health nationwide.
By analyzing 500 Cities data alongside nationwide noise pollution data, the team will now advance a scientific understanding of how this ubiquitous hazard affects mental health, sleep, and hypertension across the US. The team aims to (1) estimate associations between nighttime and 24-hour average noise and three 500 Cities health outcomes (mental health, sleep, and hypertension), and (2) identify geographic trends of associations in the context of metropolitan racial residential segregation.
The University of California, Berkeley will use spatial error modeling to estimate these associations, using exposure data from a nationwide geospatial sound model built by collaborators at Colorado State University and the three 500 Cities health outcomes.
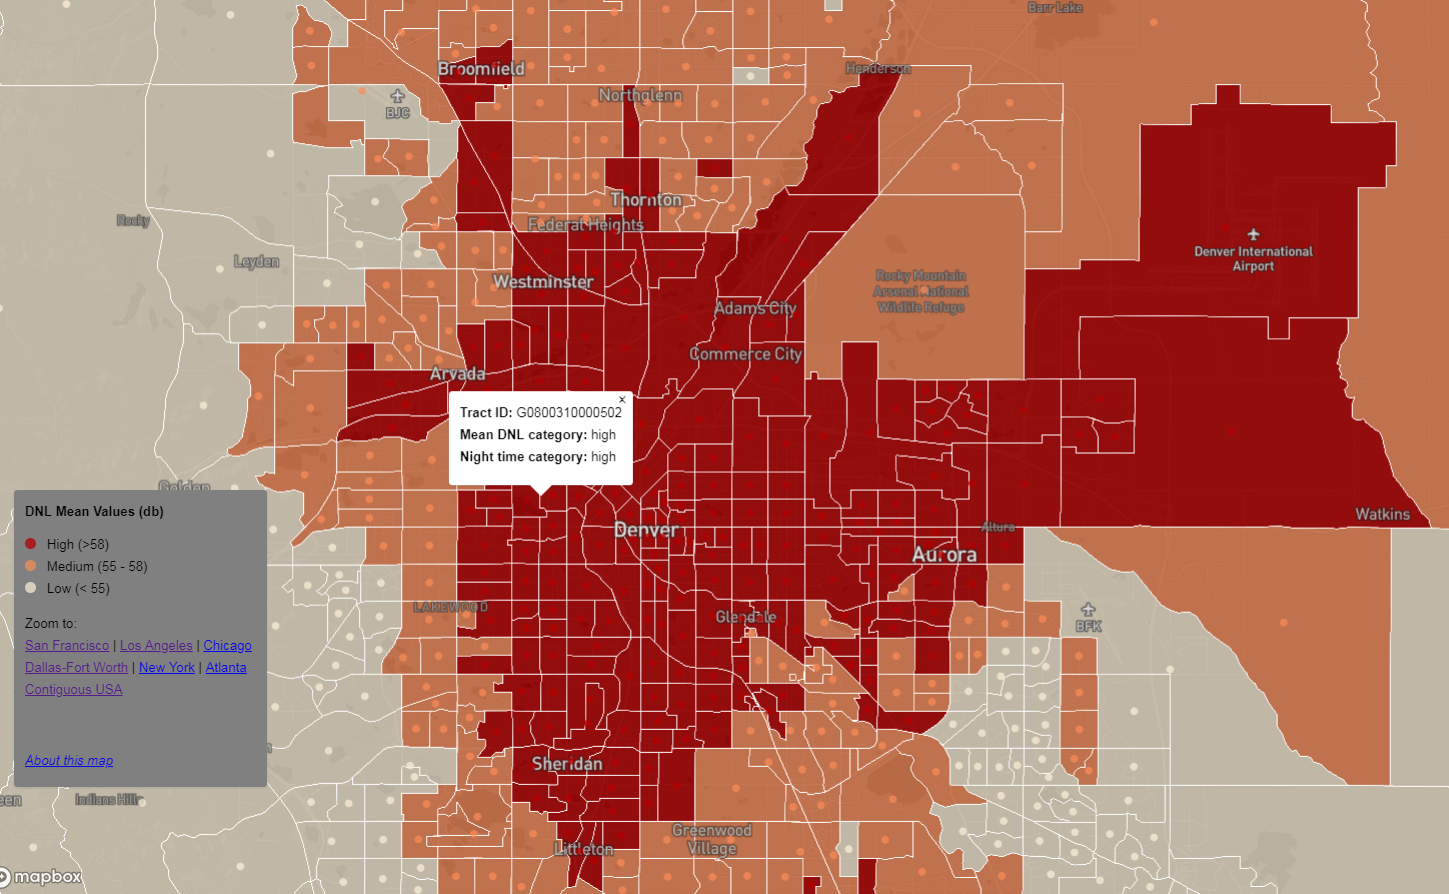
After compiling all relevant data and formulating it into its final working format, the UC Berkeley team created an online noise map that presents nationwide noise data (both 24-hour and nighttime noise) at the census-tract level. Users can zoom in to their neighborhood and discover whether noise is below, in line with, or above federally recommended levels.
The team continues to finalize their analyses of these variables' complex relationships and will publish a peer-reviewed publication that describes analytical challenges associated with using area-level data and presents associations between noise and hypertension, sleep, and mental health in the US using the 500 Cities data.
WHAT THEY LEARNED
The University of California, Berkeley team learned a lot about working with data estimated through regression modeling and poststratification. Though these data are useful for gauging the prevalence of health outcomes, they are more challenging to use in traditional epidemiological studies. Because the health outcomes were spatially predicted using indicators of socioeconomic status (e.g., poverty), it was difficult for the UC Berkeley team to fully disentangle drivers of disease prevalence (e.g., the question of whether poverty or noise pollution lead to higher levels of hypertension in specific communities).
This study's findings will be useful to other researchers dealing with similar types of spatial health data as they aim to determine driving factors and causal relationships.
WHAT THEY RECOMMEND FOR SIMILAR PROJECTS
The University of California, Berkeley team makes the following recommendation for organizations interested in pursuing similar approaches to using the 500 Cities data in their communities:
- Be mindful of duplicate census tracts for cities close in proximity. Because the 500 Cities data is urban-focused, data from cities that are geographically close might include duplicate census tracts. If one census tract spans two cities, it was cut into two pieces and included with a unique identifier in each city. This does not have large ramifications for data analysis, but it would have been helpful to know before beginning data exploration.
To learn more about University of California at Berkeley’s work, follow @joanacasey and @rmfrosch on Twitter. If you are interested in learning more about this team’s project approach or have specific questions regarding replicating their work in your community, please feel free to contact the Principal Investigator of this project, Joan Casey.