Richmond, VA
United States
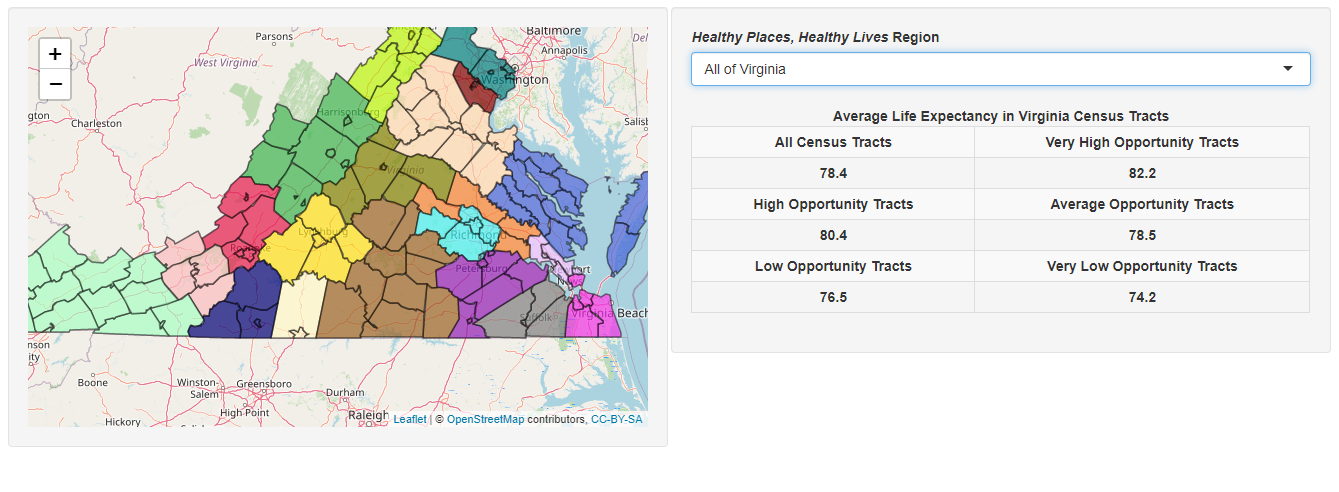
The Virginia Department of Health Office of Health Equity’s (OHE) Health Places, Healthy Lives visualization explores the relationship between the USALEEP life expectancy at birth (LEB) estimates and the thirteen social determinants of health indicators in the Virginia Health Opportunity Index (HOI). Healthy Places, Healthy Lives assists local communities to identify the programs and practices likely to improve life expectancy, along with the neighborhoods in which these programs will have the largest impact. Importantly, it demonstrates how targeting disparities and social determinants at the neighborhood level is the best approach to improving health outcomes.
HOW THEY USED 500 CITIES DATA
For many Americans, the neighborhood in which they live has a significant impact on their opportunity for optimal health. However, most measures of community characteristics and health outcomes are made at the county or metro level. These often hide vulnerable populations, diluting their impact in mapping and analysis.
Healthy Places, Healthy Lives bridges this gap by combining two robust, census tract-level measures into a single visualization. For health outcomes, the visualization uses LEB estimates created by the U.S. Small-Area Life Expectancy Project (USALEEP). For neighborhood characteristics, the visualization incorporates the Health Opportunity Index (HOI), a census tract-level index comprising 13 Social Determinant of Health (SDOH) indicators, created by the Virginia Department of Health, Office of Health Equity.
The project includes two major components:
- A statistical examination of state and regional relationships among the Health Opportunity Index indicators and the USALEEP LEB estimates (methodology, data, and code are all publicly available).
- An interactive visualization that allows users to explore these relationships and potential strategies for improving regional life expectancy.
Partners at the Virginia Commonwealth University Department of Biostatistics performed Weighted-Quantile Summation regression (WQS) at both the state and regional level. WQS regression identified the level of correlation and assigned weights to each of the HOI indicators. These weights rank the relative influence of each indicator on life expectancy and allow estimates that changes in these indicators may have on life expectancy.
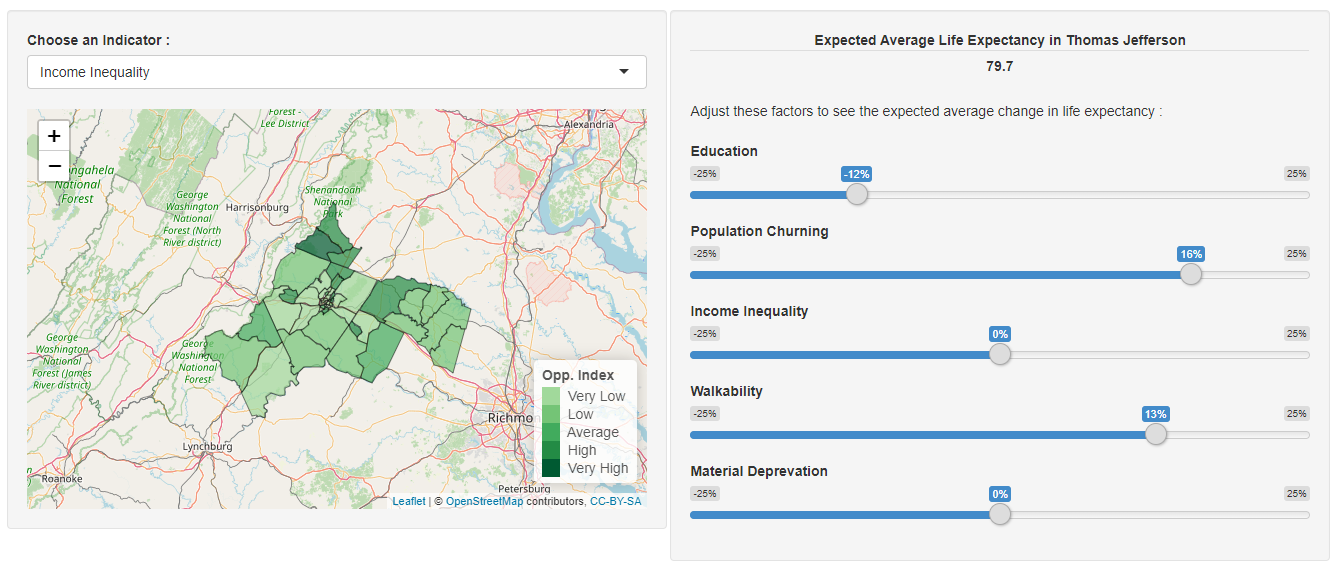
The visualization identifies the five Health Opportunity Index indicators expected to have the most impact on life expectancy regionally. Using interactive sliders, users can explore the expected effect changes in these indicators may have on LEB in their communities.
The visualization includes a list of organizations and evidence-based practices to address each SDOH factor, while an interactive map allows users to identify the census tracts where interventions are needed most.
WHAT THEY LEARNED
The WQS regression revealed several details about the relationship between social determinants of health and life expectancy. The Health Opportunity Index has a strong, positive correlation with the USALEEP LEB estimates, explaining 76 percent of the variation in LEB. At the state level, housing and transportation affordability (weight = 26%) and education (weight = 37%) were allotted the largest proportion of the association between the HOI and LEB. Other indicators with greater than 5 percent weight were population churning (7%), material deprivation (10%), and job participation (7%).
The positive correlation was generally strong at the regional level as well, including at the Local Health District level. In Virginia, Local Health Districts vary in scale from a single independent city to several counties. The WQS regression found statistically significant, positive correlations in 29 of Virginia’s 35 Local Health Districts. The remaining districts were all rural and combined with other districts in the Healthy Places, Healthy Lives (HPHL) regions used in the final analysis.
At the regional level, affordability and education continued to have the largest influence on LEB within the HPHL regions. However, there was wide variation in the distribution of weights. In some regions, one or two HOI indicators explained most of the variation in LEB, while in others several factors had a moderate role. For instance, in the Chickahominy region, education and access to care account for 62 percent of variation, while the top five indicators in the Prince William region account for 63 percent. Despite the importance of education and affordability in most regions, there were a few exceptions. For instance, in the Pittsylvania-Danville region, education barely registered. Rather, population churning and walkability had the strongest influence, followed by affordability.
The Healthy Places, Healthy Lives project is part of an ongoing effort to model and estimate the impact of SDOH factors on health outcomes. The Virginia Department of Health, Office of Health Equity will continue to develop these models so that policy-makers, programs and community groups can target resources towards the SDOH factors, populations and neighborhoods where they are most likely improve health.
WHAT THEY RECOMMEND FOR SIMILAR PROJECTS
Virginia Department of Health, Office of Health Equity has identified a few recommendations for organizations interested in conducting similar projects centering in the USALEEP data, outlined below:
- Building complex calculations into a visualization can be challenging. This is especially true when the visualization coding team and analysis team are from different organizations in different sectors. Even though the tasks seem separate and sequential, be sure to connect both teams early to ensure a smooth transition between analysis and model development into visualization.
- Linear modelling is limited when creating stratified life expectancy estimates using SDOH. VDH's original goal was to display expected changes in life expectancy by opportunity level. However, linear modeling resulted in distorted effects and average life expectancy proved more meaningful for display. More nuanced models are needed for stratified estimates.
- Regional analysis may mask larger, statewide effects. For instance, our analysis found that education of the adult population had little influence on LEB in the Pittsylvania-Danville region. However, this is likely due to the limited variation of education within the region, not the influence of education on LEB. The greater majority of Census Tracts in this region are in the “very low” or “low” quintiles, while none are “very high” in education outcomes. The overall effect of factors need to be included when estimating changes.
To learn more, follow @VDHJustHealth on Twitter. If you are interested in learning more about this team’s project approach or have specific questions regarding replicating their work in your community, please feel free to contact the Principal Investigator of this project, Justin Crow.

